Our Research
The Climate and Health Research Lab is dedicated to advancing knowledge on the impact of climate change on human health, animal welfare, and environmental sustainability. Our research initiatives focus on understanding the complex interplay between climate, ecosystems, and public health, aiming to drive positive change and improve global well-being.
Below are some of impactful research done in our Lab!
Revisiting the agro-climatic zones of Ghana: A re-classification in conformity with climate change and variability
.PNG)
The figure displays a side-by-side comparison of the old and new agro-climatic zone (ACZ) maps of Ghana, as proposed in a 2023 study published in PLOS Climate that revisits and updates the country's climatic classifications to better reflect impacts of climate change and variability. The old map, based on the Ghana Meteorological Agency's 1960s demarcation, simplifies the country into four broad zones: a vast northern "North" savannah region, a central "Transition" band, a southern "Forest" area, and a limited "Coast" near Accra.
The new map, derived from analysis of 30-year rainfall and temperature data, introduces a more dis-aggregated five-zone classification: "Sudan Savannah" in the far north, an expanded "Guinea Savannah" extending southward, a significantly reduced "Transition Zone" (largely encroached upon by Guinea Savannah, especially in the southeast), a shrunken "Forest" zone with a northwestward shift, and an broadened "Coast" now spanning the entire Gulf of Guinea coastline. Both maps share the same geographic outline of Ghana, with latitude (5° to 11° N) and longitude (-3° to 1°) coordinates, and mark key cities with red dots for reference. This updated mapping highlights clear evidence of climatic shifts, including southerly expansion of drier savannah zones and alterations with implications for agriculture, health, forecasting, and disaster management.
Monthly Entomological Inoculation Rate Data for Studying the Seasonality of Malaria Transmission in Africa
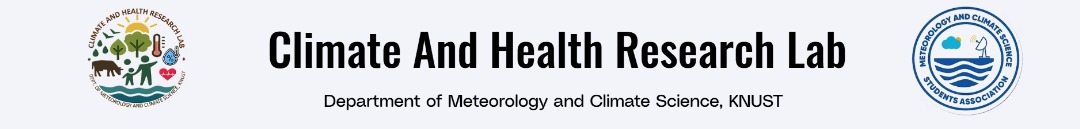
The geographical locations of extracted EIRm in Sub-Saharan Africa. The colored circles show the maximum EIRm value recorded for the location. The proximity of many of the locations are very close and hence cannot be explicitly resolved on the map. The blue lines show the boundaries of the sub-regions (Sahel, Guinea, WA and EA).
Spatiotemporal Assessment of PM2.5 in Senior High Schools in Kumasi, Ghana using Low‑Cost Sensors
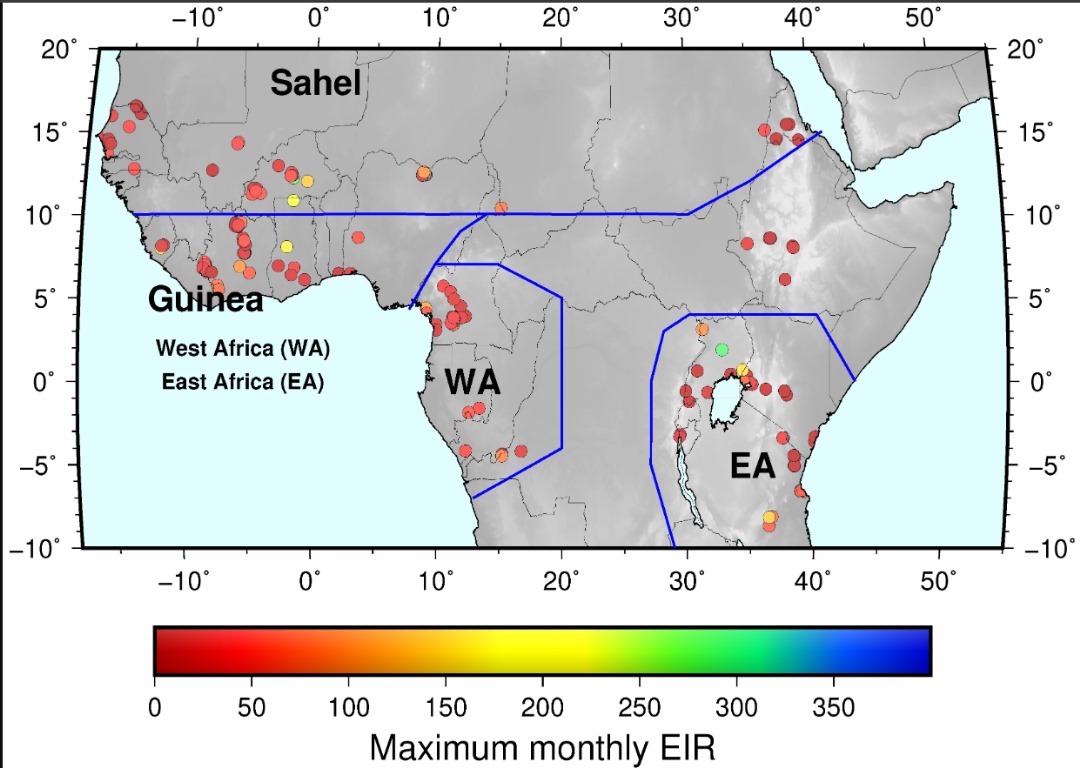
Figure 8 illustrates the AQI trends at the monitored schools from late 2022 to 2023. The data reveal clear seasonal and daily patterns across the sites. Based on U.S. EPA standards, AQI values often peaked during the dry season, reaching levels in the Moderate, Unhealthy for Sensitive Groups, and sometimes Unhealthy categories.
Improvement and validation of dynamical malaria models in Africa
.jpg)
The structural layout of VECTRI model. The top row shows the larvae status divided into a series of bins representing the fractional development state. The 'X' in each bin represents the density of larvae in a specific fractional growth stage. The middle block represents the vector state in two dimensions: the egg development within the female and the infective state. The lower row models the host infective state. The curved arrows represent the progression direction of the larvae, vector and host state, while the straight red arrows mark the parasite transmission pathways between host and vector. Source: Tompkins and Ermert (2013)